
POWER BI LOVER💖
PETER TRAN
Welcome to my Power BI portfolio - where boring spreadsheets come to die and visuals come to life.
These images may seem random, but I chose them as a subtle way to give a shout-out to my side hustle📣.One sentence describing it:
I’m selling frames that turn your sketches into glowing masterpieces 🖼️- basically art with a spotlight - and yes, free shipping Australia-wide because I’m not just creative, I’m generous too.Curious minds can check the link below!
AU Electoral BoundariesThis Power BI report provides a comprehensive spatial analysis of Australia’s electoral divisions by visualizing geographic area data in square kilometers. It leverages interactive mapping and dynamic visual elements to support understanding of state-level and electorate-level land area distributions across the country.Note: This is used for training purposes.
The NT Election CommitmentsSuccessfully collaborated with the Department of Corporate and Digital Development (DCDD) on a three-month project to improve report management for the Election Commitment .NET Application, used by the Department of the Chief Minister and Cabinet (DCM).As part of this initiative, I designed and developed 09 comprehensive paginated reports using Power BI Paginated Reports (SSRS), tailored to meet the information needs of Cabinet-level decision-makers. I optimized data extraction processes from the Election Commitment SQL Database, ensuring efficient and accurate data retrieval.Additionally, I supported the team to configure and deploy a dedicated Power BI Report Server, establishing a centralized and secure environment for hosting project-specific reports. This significantly improved report accessibility, governance, and performance, enabling better-informed decisions within the Cabinet.Note: This portfolio entry is presented as a draft version and is intended to provide a general overview of the work completed. While the final reports and project details remain confidential, this summary version is shared with consideration to privacy and without disclosing any sensitive information.
NT Health CostingThis project was part of an upskilling initiative aimed at enhancing the NT Health Costing Team’s capacity for budget analysis. The solution delivered high-level and detailed Power BI visualizations, advanced What-If analysis, and data writeback functionality to support dynamic financial planning.Key features include:
- Interactive budget modelling that adapts in real time to user inputs.
- Scenario testing to explore different financial outcomes with ease.
- Data writeback capabilities for seamless integration with planning workflows.By integrating these features, the project promotes greater self-sufficiency in financial analytics, enabling NT Health staff to make timely, data-driven decisions with improved agility and confidence.Note: This portfolio entry is presented as a draft version and is intended to provide a general overview of the work completed. While the final reports and project details remain confidential, this summary version is shared with consideration to privacy and without disclosing any sensitive information.
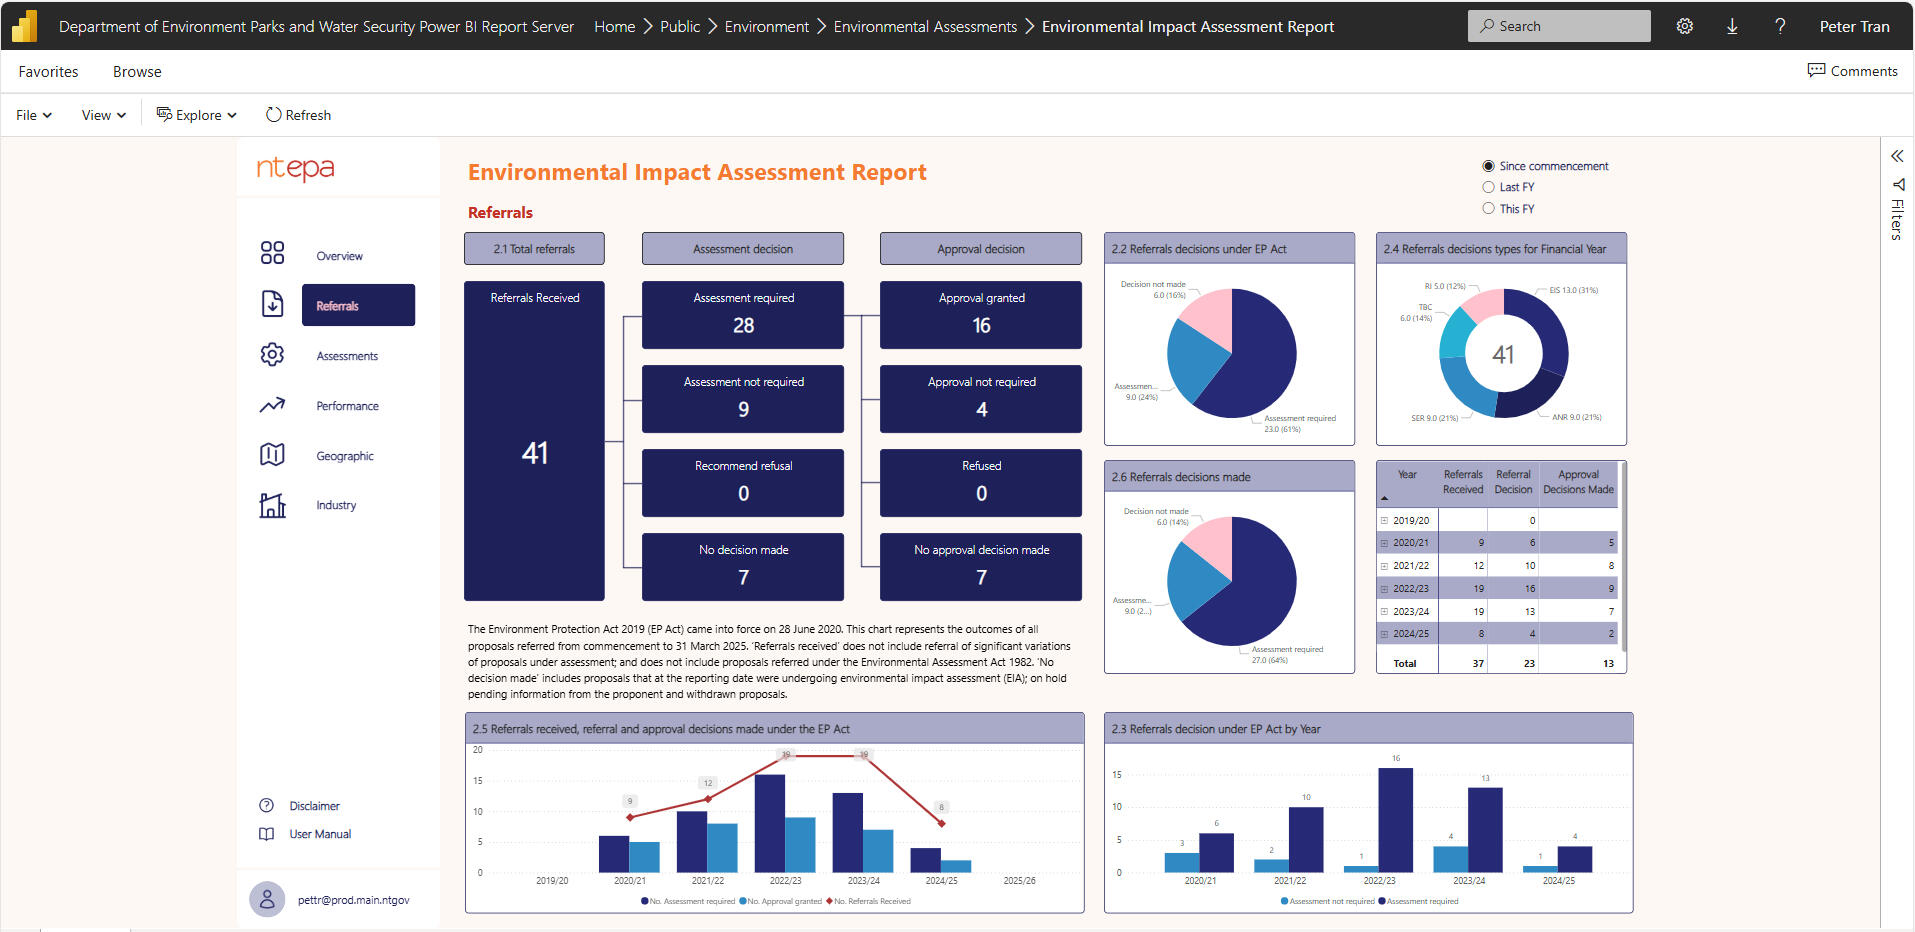
Environmental Impact AssessmentDelivered a comprehensive Microsoft Power BI dashboard and quarterly performance reporting solution for the DLPE’s EAU. Managed the entire project lifecycle, including the design, development, and implementation of dynamic, user-friendly dashboards and KPI reports. These enhancements streamlined reporting processes and provided real-time insights for decision-makers. Coordinated data aggregation, advised on infrastructure requirements for scalability and performance, and developed best-practice documentation. Delivered tailored skills transfer and training programs to DLPE staff, ensuring the successful adoption and ongoing support within a three-month project timeframe.Note: This draft portfolio offers a general overview of completed work. Final reports and detailed project content remain confidential, and this summary omits all sensitive information.
As the project is ongoing, only a limited selection of dashboard images is included for demonstration and educational use.
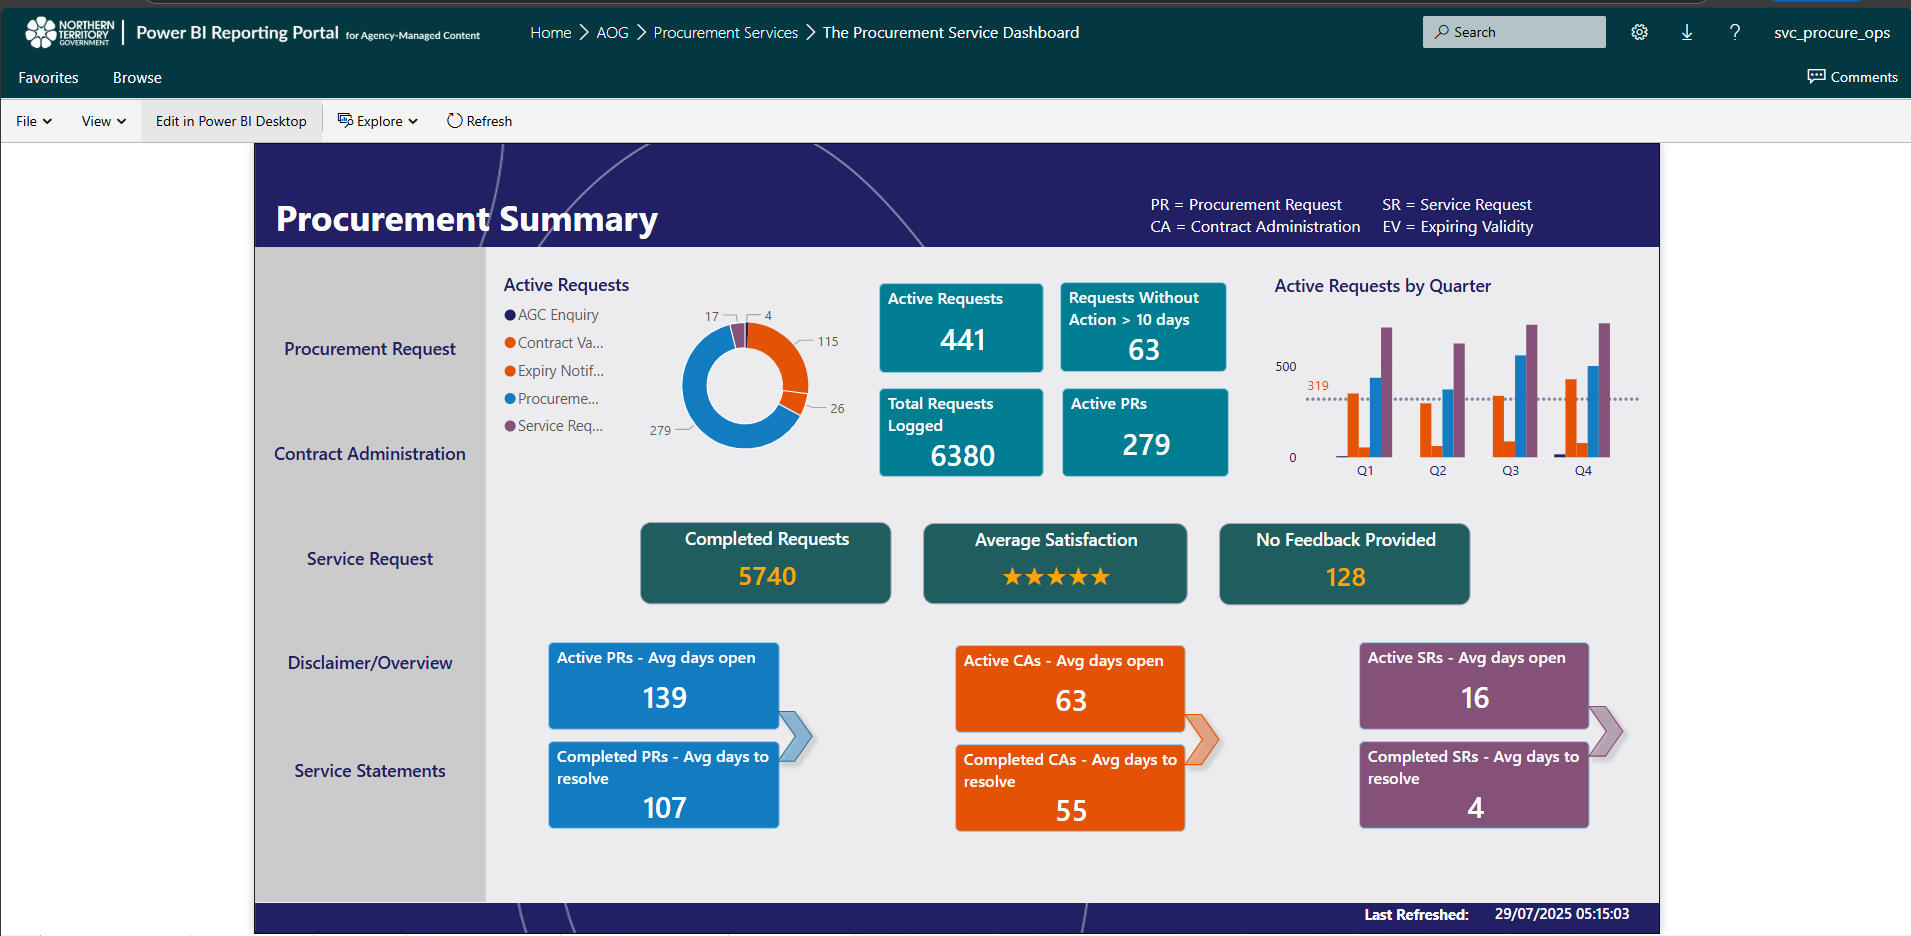
Procurement Services DashboardDeveloped a Procurement Services Jira Management Dashboard for the NTG Procurement Services team at DCDD using Power BI and Denodo. Led the design and implementation based on an existing Power BI NTG Dashboard template and integrated data, configured Role Level Security and shared reports using the whole of government Power BI platform. Overcame challenges related to large dataset management from the Jira connector by collaborating with Procurement Services team to work on a solution with Denodo technology, which significantly improved the dataflow management, KPI tracking and data integration for procurement performance monitoring.Note: This draft portfolio provides a broad overview of completed work. Due to the presence of confidential data, certain sections have been carefully prepared using placeholder, historical, or fictional information to ensure privacy and compliance. Final reports and detailed project content remain confidential, and this summary omits all sensitive details. As the project is ongoing, only a limited selection of dashboard images is included for demonstration and educational purposes.
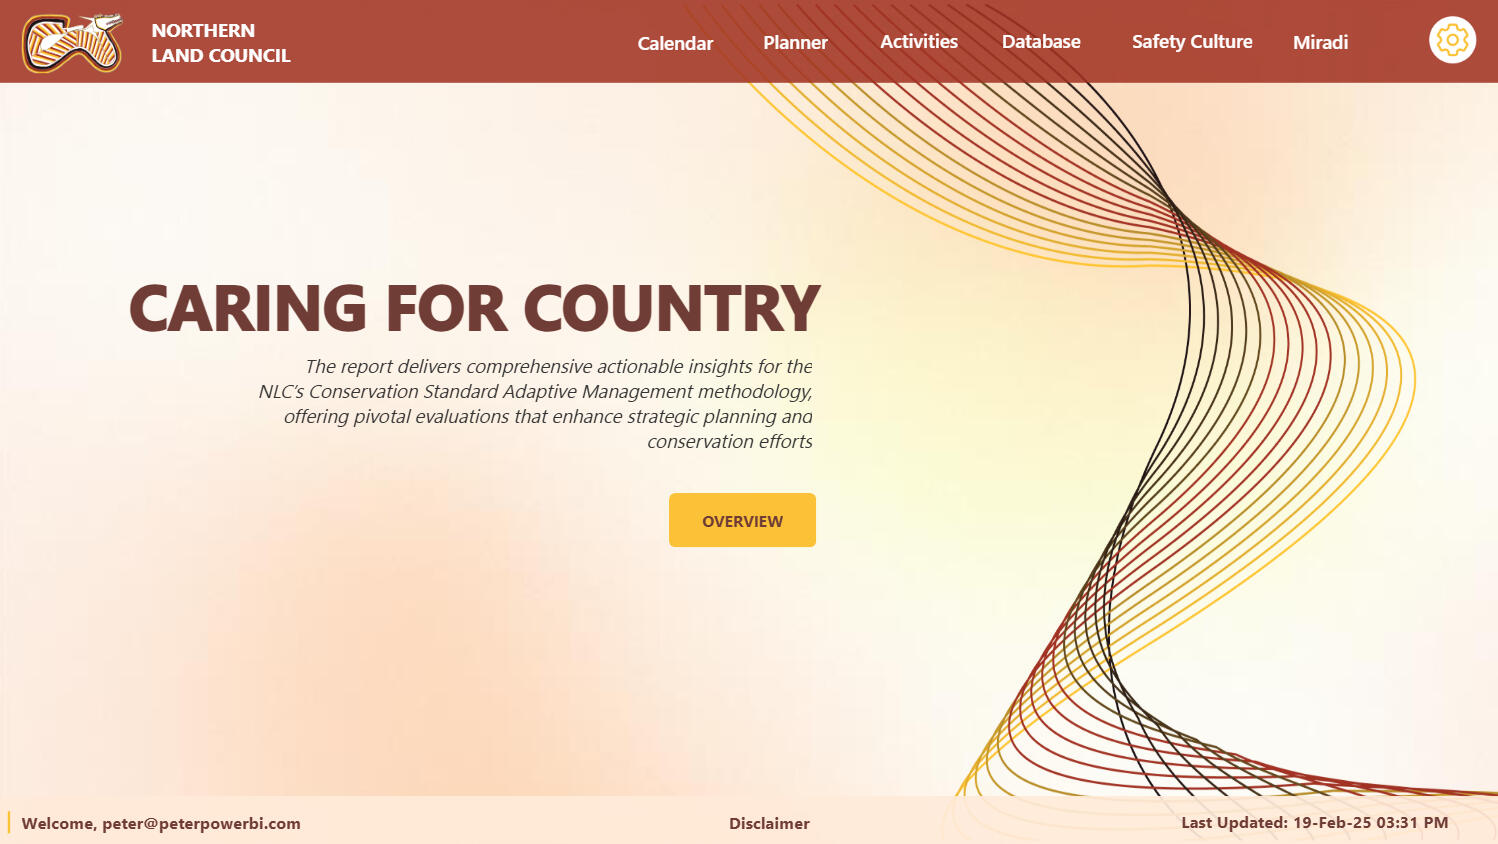
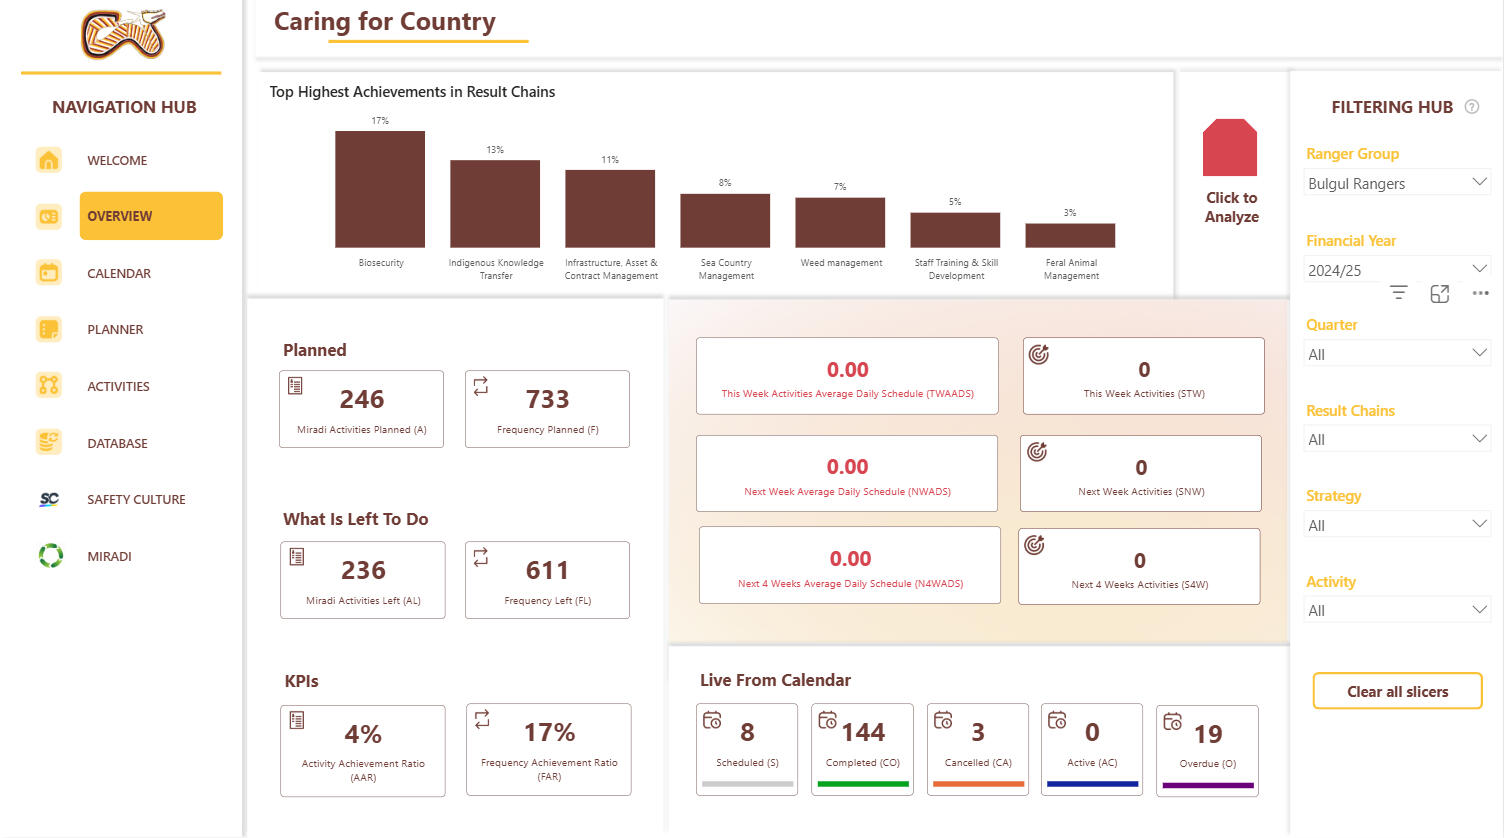
Caring For CountryLed the development of an adaptive framework for the Northern Land Council’s Conservation Standard Adaptive Management, integrating tools like Miradi, Airtable, Smart Conservation app, iAuditor, and Garmin InReach with Power BI for streamlined activity tracking and analysis. Designed reports with Power BI Dataflows and Paginated Reports for detailed quarterly and annual evaluations, strengthening strategic planning. Oversaw semantic model access, user management, data refreshes, API integration audits, and ticket support.Note: This draft portfolio provides a broad overview of completed work. Due to the presence of confidential data, certain sections have been carefully prepared using placeholder, historical, or fictional information to ensure privacy and compliance. Final reports and detailed project content remain confidential, and this summary omits all sensitive details. As the project is ongoing, only a limited selection of dashboard images is included for demonstration and educational purposes.
Connect with me
LinkedIn: https://www.linkedin.com/in/petertran1911/
Email: [email protected]
Fun fact about me 😎
🞃🞃🞃 This is my baby Power BI in the Northern Territory 🞃🞃🞃
(Thinking of making an offer on this plate? It's not for sale, but I love the enthusiasm! 🎉)


